Benefits of Solarwinds QoE
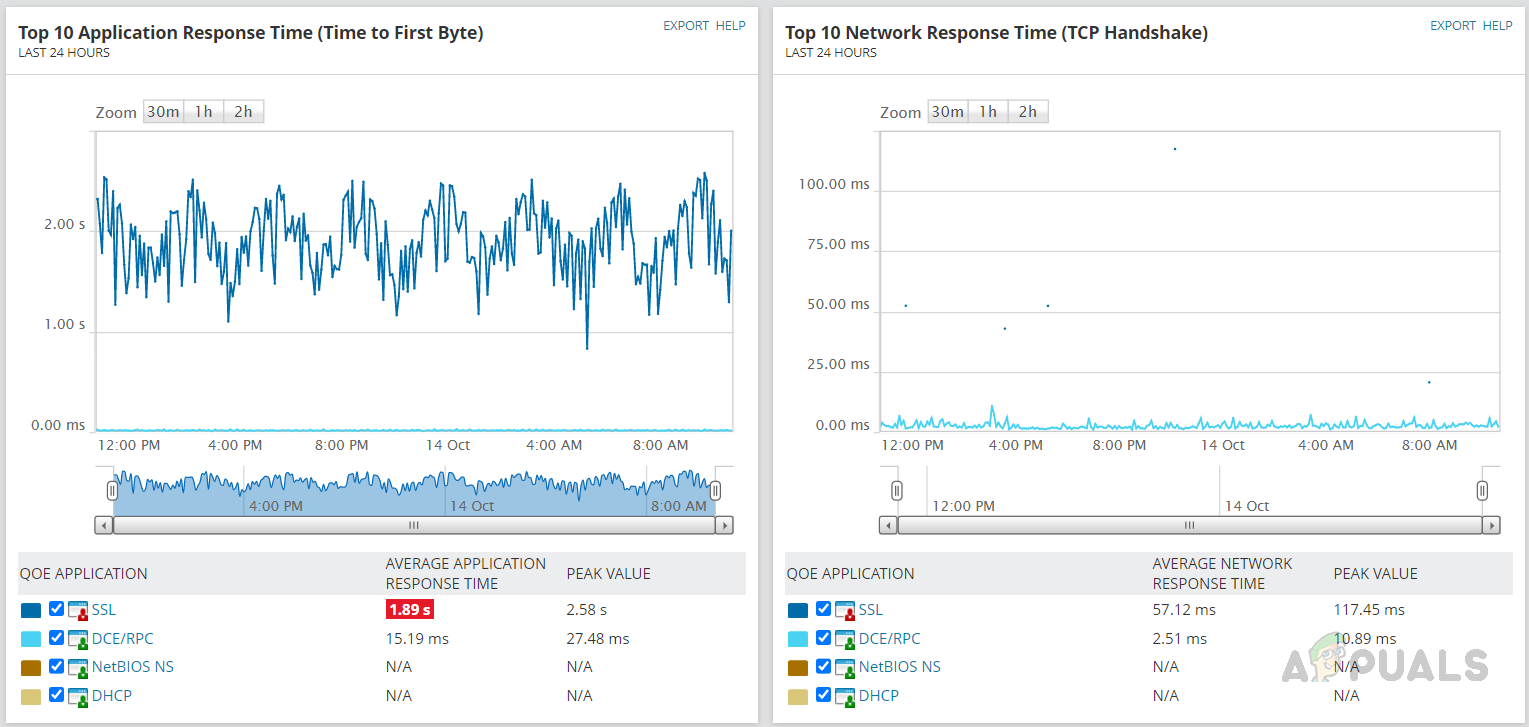
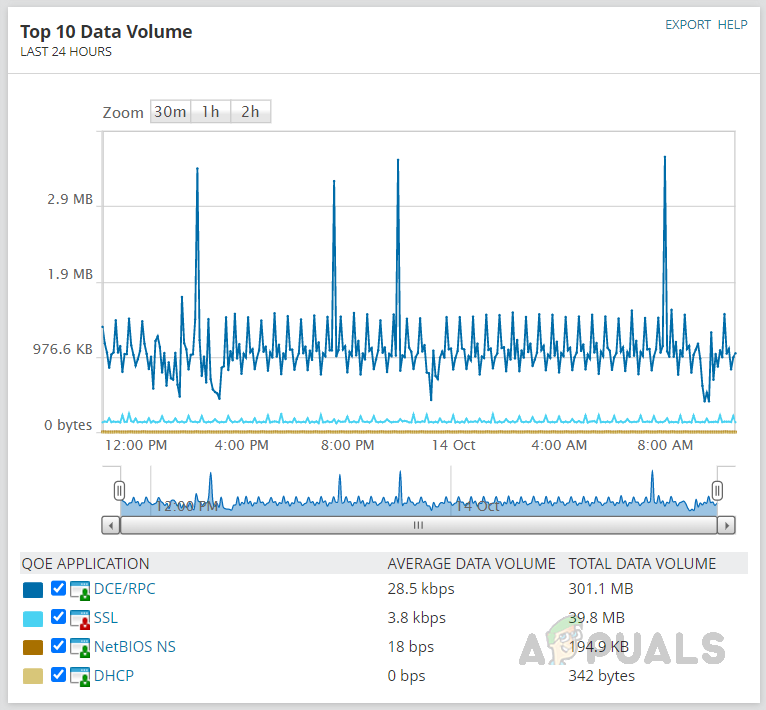
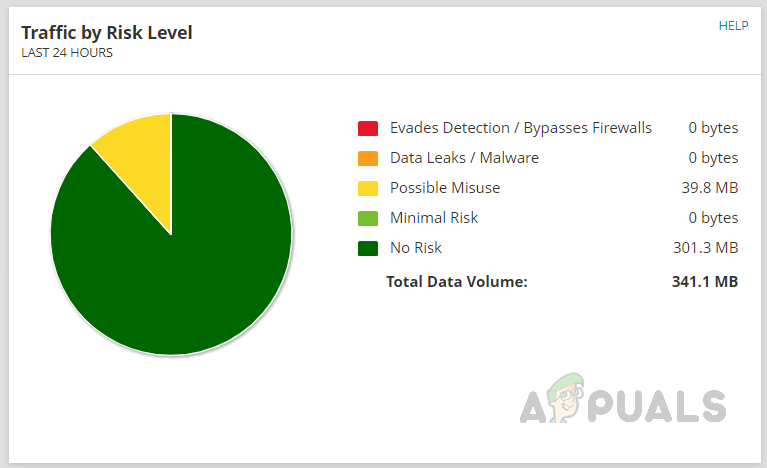
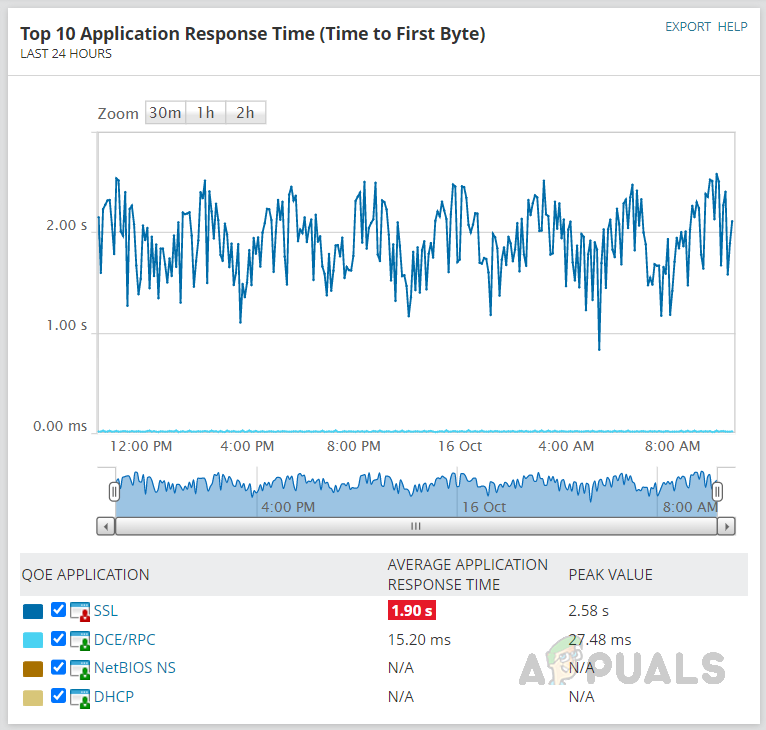
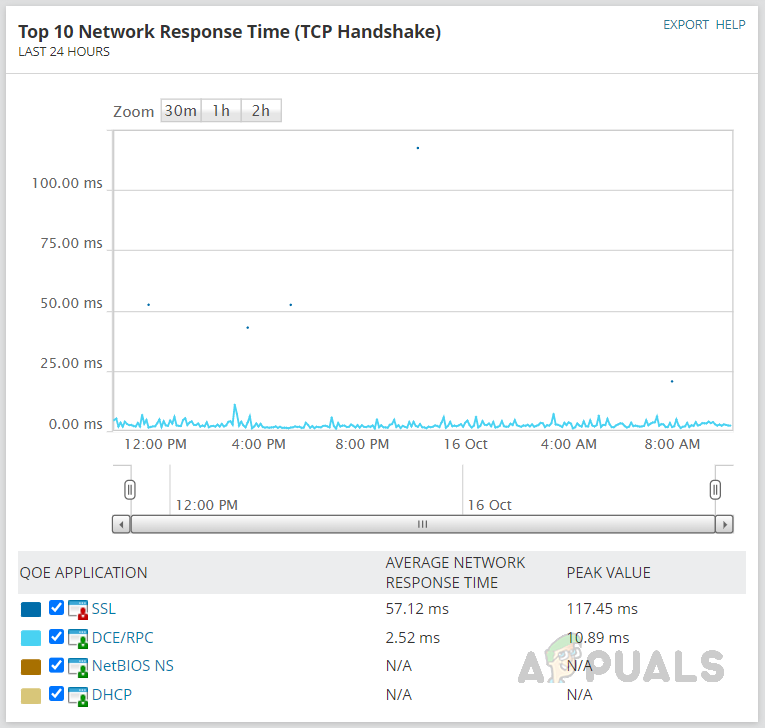
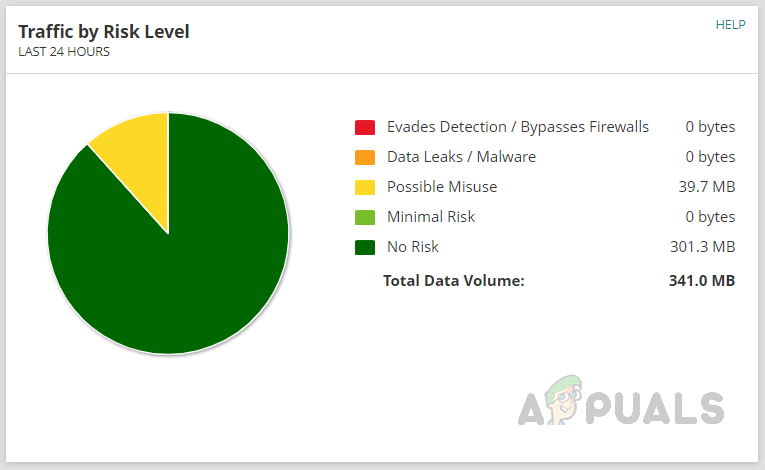
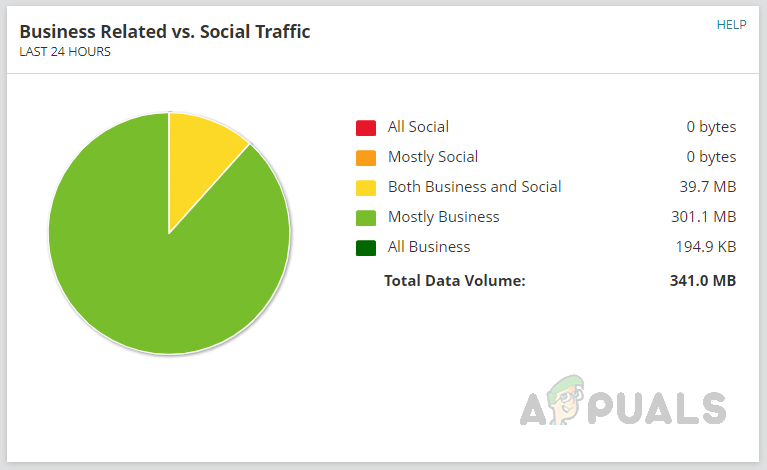
We can compare Network Response Time and Application Response Time to determine whether the issue is with the Network or the Application. Data Volume trends can be used to detect traffic anomalies and their cause. We can monitor the risky types of traffic that might lead to data leaks.
How Solarwinds QoE Works?
Solarwinds QoE uses a packet analysis sensor to monitor the packet-level traffic information from network devices and application servers. There are two types of sensors used by Solarwinds QoE to monitor and analyze traffic. On the network end, a mirror or SPAN needs to be created on the core switch to which all the application servers are connected. The mirrored port should be connected to the server where the packet analysis sensor is installed. The sensor will collect all the traffic data through this port.
1. Packet Analysis Sensors for Networks (Network Sensor)
Network Sensor captures all traffic, analyzes the packets, and categorizes the packets by the application that flows through a device. Packets are analyzed for QoE metrics like network response time, traffic volume, etc., and then the details are sent to the Solarwinds server.
2. Packet Analysis Sensors for Servers (Server Sensor)
The server sensor captures all traffic sent to or from the application server. It analyzes them for QoE metrics like application response time, traffic volume, etc., and then the details are sent to the Solarwinds server. Solarwinds QoE uses the information collected by Network Sensor and Application Sensor to detect performance issues and alert them before users identify the problem. These sensors can be deployed only on Windows-based systems. Let’s see how to deploy these sensors to capture the packets for deep analysis.
How to Deploy Packet Analysis Sensor
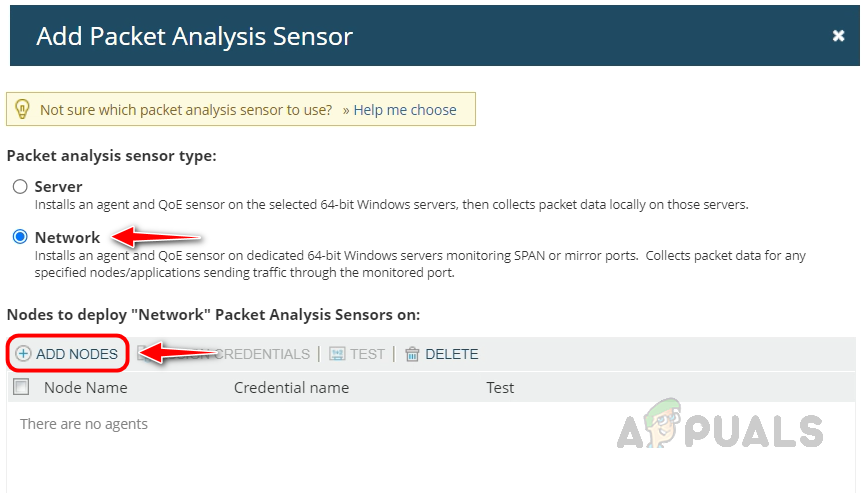
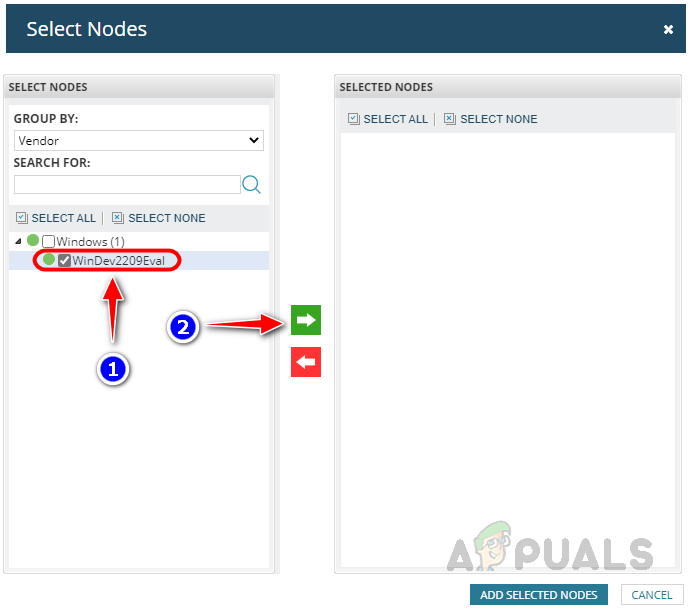
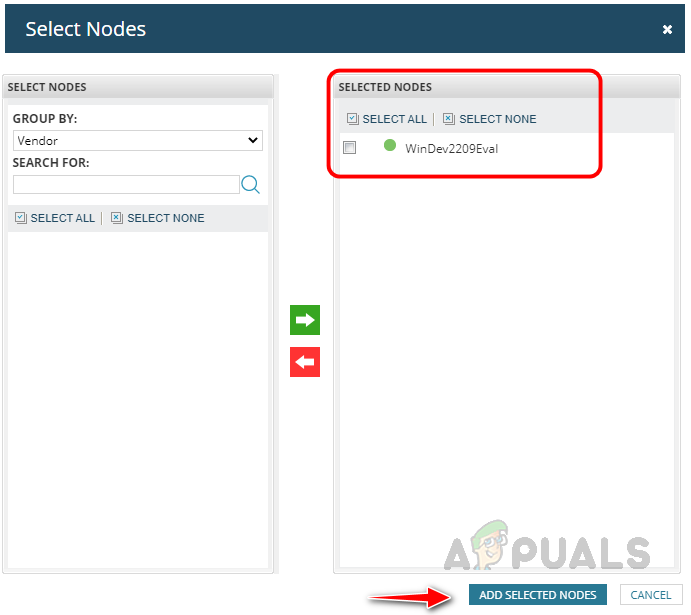
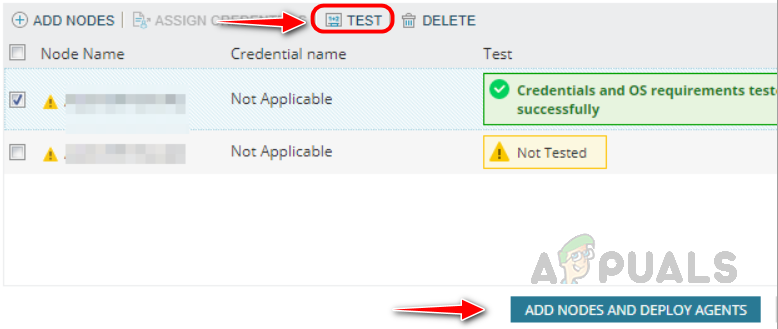
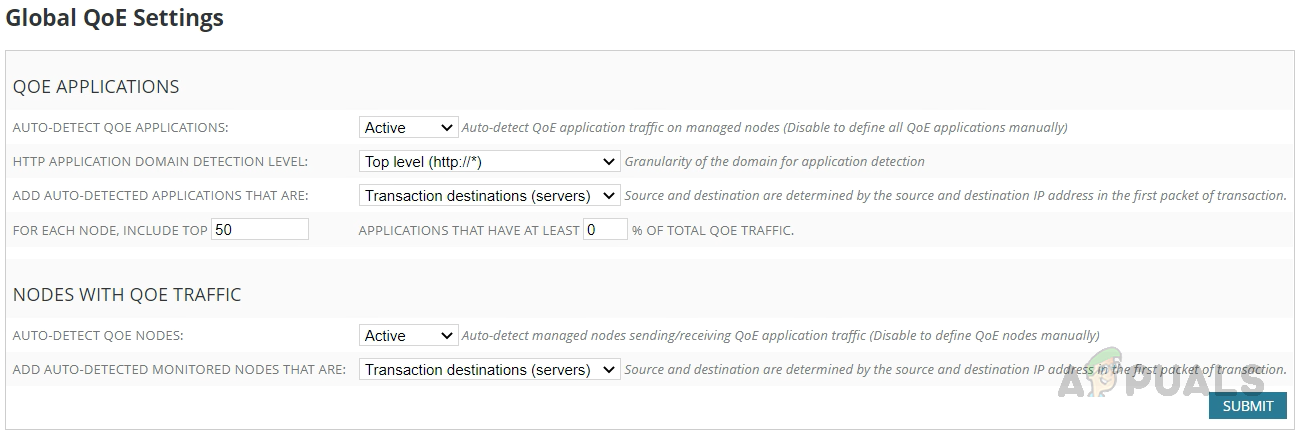
Deploying procedure is similar for both Network and Server sensors. The below steps can be used to deploy the sensors. Once the packet analysis sensor is deployed on the server and the mirrored port is connected with the sensor server, nodes and applications are automatically monitored by Solarwinds QoE. We can control the sensor server’s behavior by customizing the global QoE settings.
Configuring Global QoE Settings
Now we are good to monitor the traffic. Let’s see how to access the QoE dashboard to check the Network and Application traffic.
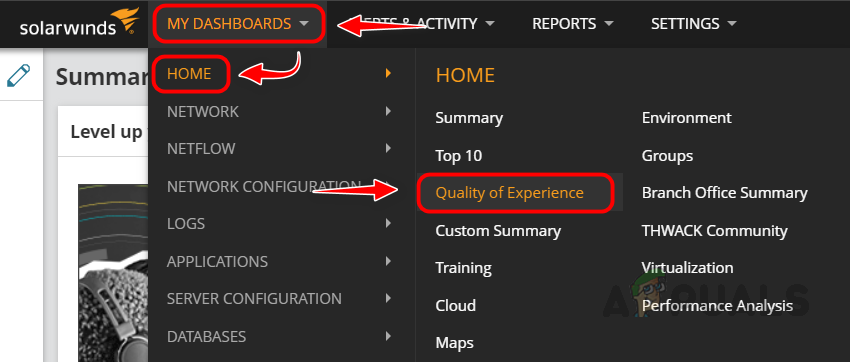
QoE Dashboard
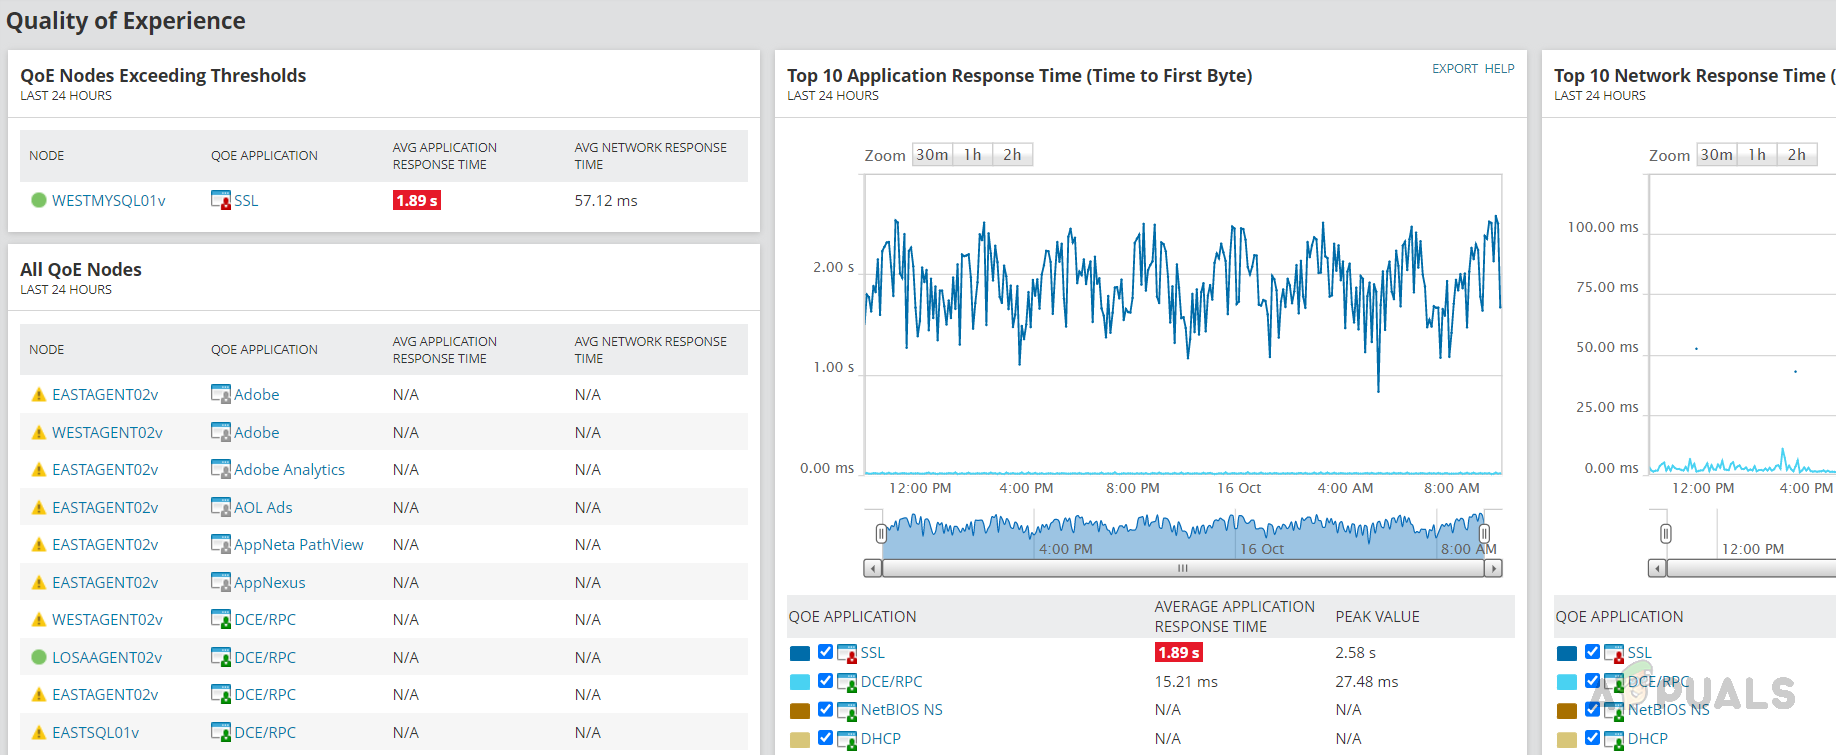
We can use the QoE dashboard to check the analyzed Network and Application data. Follow the below steps for how to check the QoE Dashboard. We can use the QoE Dashboard to review the analyzed data and check if any anomalies are found in the Network or Application traffic. Solarwinds also provides alerts for QoE. We can use the default alerts or use the default alert as a template to create a customized alert suitable for the environment.
By setting the alerts, we can avoid checking the dashboards periodically. Alerts will trigger based on the thresholds we set, and we can use the dashboard to get more details for the triggered alert. This is how we can use Solarwinds QoE to analyze the traffic in our Network to detect any anomalies affecting the end-user experience and fix them even before the end users report them.
How to Fix ‘Packet Burst’ Error in Call of Duty VanguardDead Island 2 Not so Dead After All as Producer Deep Silver Plans a Re-Reveal…Deep Learning Super Sampling (DLSS 2.0) ExplainedNVIDIA Releases Deep-Learning Dynamic Super Resolution, The AI-Powered Version…
